- Other Fluke companies:
- Fluke
- Fluke Biomedical
- Fluke Networks
- Fluke Process Instruments
See more Fluke brands

There are several calibration uncertainties to be evaluated in determining the total uncertainty of a thermocouple calibration system. This section gives an example of how to prepare an uncertainty budget for a system comprised of the following equipment when calibrating a thermocouple at 1000° C:
Figure 1 presents a sample uncertainty budget. It offers one method for aggregating some of the most important contributors to the system uncertainty. Each uncertainty has been given a code and a corresponding discussion is provided. This uncertainty analysis is comprehensive but is simplified for a general technical audience so it may be important to consult with your local NMI (National Metrology Institute) for further details or with your accreditation body (for accredited calibration labs).
The following uncertainty analysis lists each uncertainty in both standard and expanded form. The difference between standard and expanded is that the standard uncertainty has been multiplied by some coverage factor, typically stated in the form of a value of k, to become an expanded uncertainty. Or, an uncertainty is divided by a conversion divisor to estimate its standard uncertainty (k=1) value. The k value corresponds to a confidence interval. For example, in most cases, k = 2 corresponds to a 2-sigma or 95 % confidence interval. More will be explained in the "Combining uncertainties" section of this document.
| Type B standard uncertainties | Code | Standard uncertainty (°C) | Coverage factor | Expanded uncertainty (°C) |
|---|---|---|---|---|
| Measurement noise/stability of reference (n≥30) | A1 | 0.01 | 2 | 0.02 |
| Measurement noise/stability of UUT (n≥30) | A2 | 0.01 | 2 | 0.02 |
| Check standard statistic | A3 | 0.01 | 2 | 0.02 |
| 1586A readout accuracy (for reference probe) | B1 | 0.19 | 2 | 0.38 |
| Reference junction accuracy (for reference probe) | B2 | 0.01 | √3 | 0.01 |
| 1586A readout accuracy (for UUT – Type S) | B3 | 0.28 | 2 | 0.56 |
| Reference junction accuracy (for UUT – Type S) | B4 | 0.07 | 2 | 0.13 |
| Reference probe calibration uncertainty | B5 | 0.13 | 2 | 0.26 |
| Reference probe long-term drift limit | B6 | 0.06 | √3 | 0.10 |
| 9118A furnace axial uniformity | B7 | 0.10 | 2 | 0.20 |
| 9118A furnace radial uniformity | B8 | 0.12 | 2 | 0.23 |
| Total standard uncertainty (k=1) | 0.52 | |||
| Total expanded uncertainty (k=2) | 1.04 | |||
| Note: Each uncertainty is rounded to two decimal places after calculations are applied. | ||||
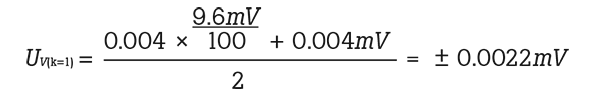
Measurement noise is the uncertainty caused by the noise or instability of the measurement readings. Each measurement point is based on the average or mean of 30 or more readings or samples. The uncertainty of the noise or instability of the 30 readings is calculated by dividing the standard deviation of the 30 samples by the square-root of n (n = 30). This calculation is often referred to as Standard Error of the Mean.
Typically, measurement noise covers both readout noise and heat source instability. The manufacturer’s specification for heat source stability may be similar, but it is best to make measurements and monitor actual standard deviation to ensure that the uncertainty analysis requirements are met.
Either the actual measurement standard deviation or corresponding Standard Error of the Mean can be entered into the uncertainty analysis each time a measurement is made, or a measurement noise limit can be assigned to each measurement point. In the case of a limit, the measurements are monitored to verify that the stability (standard deviation) meets the limit stated in the uncertainty analysis. In this example, we will use a standard deviation limit.
The following equation demonstrates how to make this calculation:

Tip: If readings are in units of voltage (mV), divide UA1 by the sensitivity of the thermocouple to convert to temperature (°C).
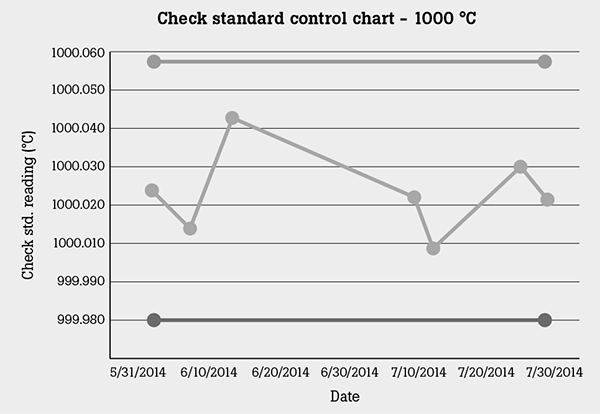
The check standard statistic is an indication of the stability of the calibration process. It is a good idea to measure a check standard probe along with the UUTs. The check standard measurement results are plotted in a control chart and analyzed to make sure no unexpected errors occur.
A check standard should be similar to the UUT so that changes in the process will affect the check standard and UUT in the same way. A check standard made of non-noble metal material may not be sufficiently repeatable to indicate the long term stability of the calibration process. It is recommended to use a high-quality Type S or Type R thermocouple as a check standard.
The value entered into the uncertainty analysis is the standard deviation of the check standard measurements over time. For example, the Figure 2 table shows readings taken from multiple runs in a calibration process. Standard deviation of the seven check standard readings is calculated to be 0.011 °C. This can be entered into the uncertainty analysis, but it is best to continue to add more readings and update the Check Standard Statistic component until the count reaches 30 or greater. This number is also used to establish control lines on the check standard control chart. The standard deviation (σ) value is multiplied by two or three to establish 2-σ or 3-σ control lines, depending on what your requirements are. The Figure 3 sample control chart shown has 3-σ control lines.
| Check standard reading (°C) | |
|---|---|
| Run 1 | 1000.025 |
| Run 2 | 1000.014 |
| Run 3 | 1000.042 |
| Run 4 | 1000.022 |
| Run 5 | 1000.008 |
| Run 6 | 1000.031 |
| Run 7 | 1000.021 |
| Standard Deviation = ± 0.011 °C |
Readout accuracy applies to both the reference probe and UUT. The following calculations demonstrate how to convert typical thermocouple specifications into values that can be entered into the uncertainty analysis.
Since most thermocouple readouts are specified in terms of voltage accuracy, the following equation converts voltage uncertainty to temperature:

Tip: Calculate SMJ by using a thermocouple voltage table. It is the change in voltage (mV) per 1 °C change (ΔV/ΔT).
The 1586A readout accuracy for the reference probe is:

The reference junction may be external or internal. In this example, an external reference junction is being used. The uncertainty of the external reference junction is dependent on the type of equipment being used. Most laboratories use a 0 ºC temperature source such as an ice bath or a dry-well like the Fluke 9101 Zero-Point Dry-Well. Uncertainties associated with an ice bath can be as low as a few mK but this requires careful technique and can be complicated. The Fluke Primary Temperature Calibration Laboratory uses a simplified approach by building an ice bath with shaved ice and tap water but monitoring the temperature with a thermistor probe and readout. The uncertainty in this approach is based on the acceptable temperature range of the ice bath, which is 0 ºC ± 0.025 ºC. To build an ice bath with lower uncertainty, refer to ASTM document E563-11 “Standard Practice for Preparation and Use of an Ice-Point Bath as a Reference Temperature.”
The following equation is used to calculate the effective reference junction temperature uncertainty. When measuring a thermocouple, both junctions contribute to the measurement. Therefore, the reference junction uncertainty is multiplied by the ratio of the thermocouple sensitivity values (Seebeck) at the temperature of the reference junction and measuring junction to calculate the effective reference junction uncertainty.

The temperature uncertainty of the reference junction in this example would be:


In this example, the corresponding uncertainty for the internal reference junction is calculated using the following equation.

The temperature uncertainty of the internal reference junction in this example would be:
This uncertainty is transferred directly from the calibration certificate of the reference probe. If the uncertainty at a particular temperature point is not listed on the certificate, it will have to be calculated. Consult with the provider of the calibration for advice on how to perform this calculation. A safe, but typically over-estimated, approximation is to choose the higher uncertainty of the two surrounding reported temperature points.
If the reference probe is a thermocouple, be sure to account for inhomogeneity. If the calibration uncertainty does not address inhomogeneity, it will be important to include an additional uncertainty component to account for it. Consult with a reputable calibration laboratory or NMI for more information on this topic.
Reference probe long-term drift can be difficult to determine. Manufacturers may specify long-term drift using a value based on a certain number of hours of use at maximum temperature. This really only addresses material aging and doesn’t cover other sources of drift such as handling, mechanical shock, and temperature cycling. It is suitable to start with the manufacturer’s long-term drift specification, but it is important to monitor the probe for drift.
The main contributors to the uncertainty analysis from the furnace are stability and uniformity. Stability is already accounted for in A1 and A2 measurement noise, as this uncertainty describes the general noise of the calibration system, including furnace stability. Uniformity is specified in two parts; radial (hole-to-hole) and axial (the gradient over different depths into the equilibration block). These are specified by the manufacturer and are listed in Figure 4. You can rely on these numbers for a preliminary uncertainty budget, but best practice dictates that they must be verified. In some cases, the uncertainty may be lowered because the unit is performing better than the manufacturer specification. To estimate the uniformity values at 1000 °C, use the values stated for 700 °C and 1200 °C and interpolate linearly.
| Radial uniformity | ||
|---|---|---|
| Temperature | 9118A (14 mm (0.6 in) from geometry central point) | 9118A-ITB hole-to-hole |
| 300 °C | ± 0.5 °C | ± 0.1 °C |
| 700 °C | ± 0.5 °C | ± 0.20 °C |
| 1200 °C | ± 0.5 °C | ± 0.25 °C |
| Axial uniformity | ||
|---|---|---|
| Temperature | 9118A (± 30 mm (1.2in) axial length from geometry central point) | 9118A-ITB (at 60 mm (2.4 in) from full immersion) |
| Full range | ± 0.25 °C | ± 0.2 °C |
| Axial uniformity | ||
|---|---|---|
| Specification | 9118A | 9118A-ITB |
| Stability | ± 0.2 °C | ± 0.1 °C |
| Stabilization Time | 2 hours, full range |
3 hours at or below 700 °C, 2 hours above 700 °C |
| Note: Temperature stability measured as 2-sigma over 30 minutes | ||
In order to combine all of the uncertainty components, they first must be converted to standard uncertainties. To do this, it is important to understand the type (distribution) of each uncertainty so the correct conversion calculation can be done. In this uncertainty analysis, there are two kinds of uncertainties in the table—normal distribution and rectangular distribution.
A normal distribution uncertainty is an uncertainty that tends to have the most results in the center, so the distribution is shaped like a bell curve. A rectangular distribution has equal probability that the result will reside anywhere inside the limit, so the distribution is shaped as a rectangle. Quite often process limits, such as long-term allowed drift, are assigned a rectangular distribution. If it is unknown what the distribution is, it is safe to assume that is a rectangular distribution.
To convert an expanded (k=2 or k=3) normal distribution to standard uncertainty (k=1) form, you simply divide it by the k value. To convert a rectangular uncertainty to its standard form, divide it by the square root of 3. For converting other types of uncertainty distributions, refer to the GUM (Guide to the Uncertainty in Measurement) or some other reliable source of information on how to calculate uncertainties.
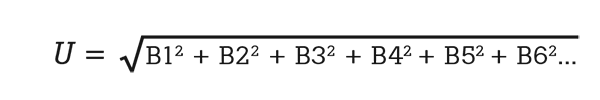
Finally, to combine the standard uncertainties in order to calculate total uncertainty, it is important to know if each uncertainty is independent or correlated. An independent uncertainty is one that has nothing in common with the other uncertainties. All independent uncertainties can be combined or added together using Root Sum Squares (RSS). An example of RSS is shown below. A correlated uncertainty means that it has some type of correlation or relationship with one or more other uncertainties. Correlated uncertainties can often be added together with simple addition and then the sum is added by RSS with the other uncertainties. Sometimes more sophisticated techniques of calculating correlations are used but this uncertainty analysis doesn’t require that.
In this uncertainty analysis, the 1586A readout accuracy uncertainties are correlated since the same instrument is used to measure both the reference probe and the UUT. Therefore they are added by simple addition first, then combined with the others using RSS. After the total standard uncertainty is calculated, it is multiplied by the desired coverage factor, in this case 2, for k=2 (95 %), to arrive at the total expanded uncertainty.
1 of 4: Thermocouple Fundamentals
2 of 4: How to Select Thermocouple Calibration Equipment
4 of 4: How to Calibrate a Thermocouple